
The call usually starts the same way: “We got hit by the update.” A drop in Search Console, a date that lines up with something on the Search Status Dashboard, and a conclusion. Then the decomposition shows brand queries flat, non-brand down across one folder, and the folder’s canonical tags pointing at a staging domain since the deploy two days before the update began. The update was a date. The canonical was the diagnosis.
A website rankings loss audit is the investigation that separates those two. It establishes what dropped (positions, impressions, clicks or all three, because they fall for different reasons), where it dropped, when, by how much, and what took the place your pages used to hold, before it names a cause. Most guides for this term list the same eight causes and check them in parallel. This one runs them in the order of what it costs to rule each out, because the cheapest checks catch most of the cases, and the expensive one, “it was the algorithm,” is also the one you can’t prove.
Positions, impressions and clicks: which metric dropped
Rankings, traffic and clicks are reported together and lost separately. Positions can fall while traffic holds, if the queries that slipped were the ones nobody clicked. Traffic can fall while positions hold, if the result page grew a feature above you, an AI Overview or a video carousel or a forum thread block, and the click went to it. And impressions can rise while clicks fall for a reason that’s new this year.
HOW SEARCH CONSOLE COUNTS AI MODE
According to Google’s Search Console documentation as updated in August 2026, each follow-up inside an AI Mode conversation counts as a new query with its own impression and position. A page cited in a long conversation logs many impressions and, usually, no click. In the Performance report it looks like growth: impressions up on queries you never targeted, clicks flat.
A traffic loss audit is wider, since it covers every channel. This article stays on organic. But within organic, the first question is which of the three moved, and Search Console answers it in one view: Performance → Compare, previous period, with impressions, clicks and average position on the same chart. Three lines, and the gap between them is the first piece of evidence.
Verifying the drop: Search Console, GA4, Bing, seasonality
The cheapest check, and the one most often skipped. A rank tracker that swapped its location setting, a Search Console property that lost a subdomain, a GA4 tag that fell off the template in the redesign: each produces a cliff that looks like a ranking loss and isn’t. Google Analytics against Search Console settles the first half: if GSC clicks are flat and sessions fell, the loss is measurement. Google against Bing settles the rest: if Bing Webmaster Tools shows the same drop on the same date, the cause is on your site, because Bing didn’t run Google’s update; if only Google moved, the cause is on Google’s side or in how Google reads you.
Then seasonality, compared year over year rather than month over month, because “down 20% from July” is the shape of most B2B traffic in August. Then the country filter, since a US property reading a UK-only drop looks like a mild site-wide one. Search Console’s interface holds 16 months, which is enough for one year-over-year read and not two. The Bulk data export to BigQuery has no such cap. A site that switched it on in 2023 has three years of daily query and page data, and on any site that has ever had a drop worth auditing, it should have been running since before the drop. If it wasn’t, the baseline is whatever the rank tracker kept.
Decomposing the drop: date, folder, brand vs. non-brand, metric
Once the drop is real, it gets located before it gets explained. The question has five parts, when it started, where on the site, which queries, how much and in which metric, and the pattern the answers form points at the cause more reliably than any single check.
When is the first date the line bends, which is rarely the date somebody noticed. Daily, read against two calendars: the site’s deploy log and Google’s Search Status Dashboard. Where is a regex on the folder or template in the Performance report’s Page filter, read one segment at a time. Which queries starts with brand against non-brand, because those two move for different reasons: in the Query filter, Custom (regex) with the brand name and its common misspellings gives brand, and the same regex under Doesn't match regex gives everything else. How much is position loss against click loss per segment; a page that fell from 3 to 5 and lost 60% of clicks tells a different story from one that fell from 3 to 5 and lost 10%. The patterns:
| Pattern in the decomposition | What it usually means | Where to look next |
|---|---|---|
| Everything down, brand included, overnight | Technical, reporting, or security — Google stopped reaching or trusting the site | Exclusion ladder, rows one to three |
| Brand flat, non-brand down site-wide | A search-side reassessment: update, site-wide quality signal, or a lost link set | The update question, then displacement |
| One folder or template down, the rest flat | A rule shipped in that template: canonical, noindex, rendering, internal links removed | Template fingerprint, deploy log |
| One country or language down | hreflang or canonical conflict, geo-redirect, a locale folded into another | Indexation per locale |
| Mobile down, desktop flat | Rendering or mobile parity — what the mobile version lacks, the index lacks | Raw vs rendered crawl on a mobile UA |
| Positions flat, clicks down on a query set | The result page changed above you: AI Overview, video, forums, a new SERP feature | Search appearance filter, then displacement |
| Impressions up on new queries, clicks flat or down | Cited inside AI answers without a click; AI Mode follow-ups counted as new queries | Search appearance, query list sorted by impressions with zero clicks |
A large tail of pages moving from Indexed to Crawled – currently not indexed, no template change | A site-wide quality reassessment: the tail has been reclassified as adding nothing | The reassessments that send no letter |
| A cluster of related queries down, one page holding them | Displacement by a competitor page, or by your own newer page | What replaced you |
| A slow slope over months, no event on either calendar | Decay: content aged, internal links thinned, the SERP moved without you | The slow kind |
The decomposition is also where “page authority drop” gets a reading. When a page loses positions after a redesign and its external links are unchanged, the authority it lost is internal: the links from the navigation, the category page, the three related articles that used to point at it were removed with the old template, and the page now sits four clicks deep with two inlinks. That’s measurable in the crawl before and after, and it’s a template finding; the enterprise SEO audit reads every layer that way, one check per template.
Ruling out causes in order: access, manual actions, site changes
Causes get ruled out in the order of what it costs to check them, and the ladder is short because the cheap rungs catch most of what walks in.
Reporting — already done above.
Access — can Google still fetch, render and index the pages that dropped. This is the technical audit, read here for one thing only: what changed. Search Console’s Pages report against the deploy date: a jump in Excluded by 'noindex' tag, Blocked by robots.txt, Redirect error, Soft 404, Alternate page with proper canonical tag or Duplicate, Google chose different canonical than user dated to a release is the finding, and each status names the mechanism. A staging robots.txt shipped to production. A canonical rule in one template pointing every page at its parent, which is the opening of this article and the self-inflicted drop I see most. A JavaScript framework upgrade after which the raw HTML ships an empty shell and the content only exists after render, so URL Inspection’s HTML tab shows nothing where the screenshot shows a page. A deleted section redirected wholesale to the homepage, which Google reads as soft 404s and drops. None of these needs an update to explain it, and every one of them coincides with an update often enough that the update gets the blame.
The same rung has a slower version: Google still reaches the site but visits it less. Crawl stats (under Settings, 90 days of history, so it gets pulled before the window closes) shows total requests falling from a date, the logs show verified Googlebot dropping off one template, and the Pages report shows the tail sliding into Discovered – currently not indexed. Positions fall afterward because the index is holding a version of the pages that’s weeks old, and the cause is usually upstream: a response-time regression, a run of 5xx, or a crawl allowance spent on a parameter explosion that shipped with the same release. The full reading of that layer is the technical SEO audit; the rankings-loss version is the diff between two crawls, one from before the date and one from after, and the Wayback Machine when the “before” crawl doesn’t exist.
Security and manual actions — two reports, thirty seconds, and the only two causes that announce themselves. Security issues catches the hacked-page and injected-redirect cases. Manual actions is empty for almost every site that comes in convinced it was penalized; when it isn’t empty, the report names the policy, the fix is the reconsideration path, and the rest of this audit waits. A manual action is the rarest cause on this list, and it’s the one people check for first.
What the site itself changed — the migration nobody mentioned, the content rewrite that removed the FAQ block that held the featured snippet, the merge of two pages into one that answered neither. The Wayback Machine, page by page for the pages that dropped, against the current version. Migrations produce the largest drops on this rung and have their own signature: the old URLs gone from the Pages report, the new ones in Discovered – currently not indexed, and a redirect map that covers the top 200 URLs and none of the long tail that carried the traffic.
Google core update attribution: rollout window and the competitor-set test
Only now does the calendar matter. If the first bend in the line sits inside a confirmed rollout window on the Search Status Dashboard (2026 has had a core update cycle plus spam updates in March, June and August), the update is a candidate. It isn’t a conclusion.
Coincidence is cheap. Rollouts run one to three weeks, sites deploy every day, and a drop that starts inside a window has a deploy inside the same window more often than not, and the deploy is checkable while the update isn’t. Google’s own guidance on core updates says sites that lose ground typically don’t recover until a subsequent core update, and sometimes recover then without changing anything, which means the update explanation is unfalsifiable on the timescale a business needs an answer.
During a rollout, don’t change anything on the pages that dropped, because whatever you change, you’ll never know which of the two moved the line. And after it, treat “the update” as a description of when, and keep working down the list to find what the reassessment landed on: the pages that dropped, read against the pages that replaced them. Sometimes that read comes back empty, the pages as good as the replacements by every measure you have. Then the report says so and names the date to measure again, instead of inventing a cause to fill the slot.
Of the drops that arrive already blamed on an update, two shapes account for most of what I’ve read this year. Both are in the next section, with the charts.
Site-wide quality reassessment, scaled content abuse and neutralized links
Between the update rung and displacement sits a class of cause that the top-ranking guides fold into “the algorithm” and that deserves its own reading, because it has a signature and a test. Google’s spam and quality systems mostly don’t penalize; they reclassify and discount, without a Search Console notification, and the effect on the line is indistinguishable from an update until you decompose it.
Site-wide quality. The helpful-content signal has been site-wide since 2022 and part of core ranking since March 2024, and scaled content abuse has been a named spam policy since the same month, with the August 2025 spam update and this year’s three aimed at that shape. What it looks like from inside: brand flat, non-brand down across the site rather than one folder, and a wide tail of templated or generated pages sliding from Indexed to Crawled – currently not indexed with no template change on the deploy log. The pages that carried answers usually hold; the tail that restated the SERP is what gets discounted, and it drags the templates that sell with it. The test runs per template: score a sample of each template’s pages for information gain against the SERPs they targeted, and the templates that come back as echo are the ones the classifier found. A content audit that grades the tail is the same read at page level.
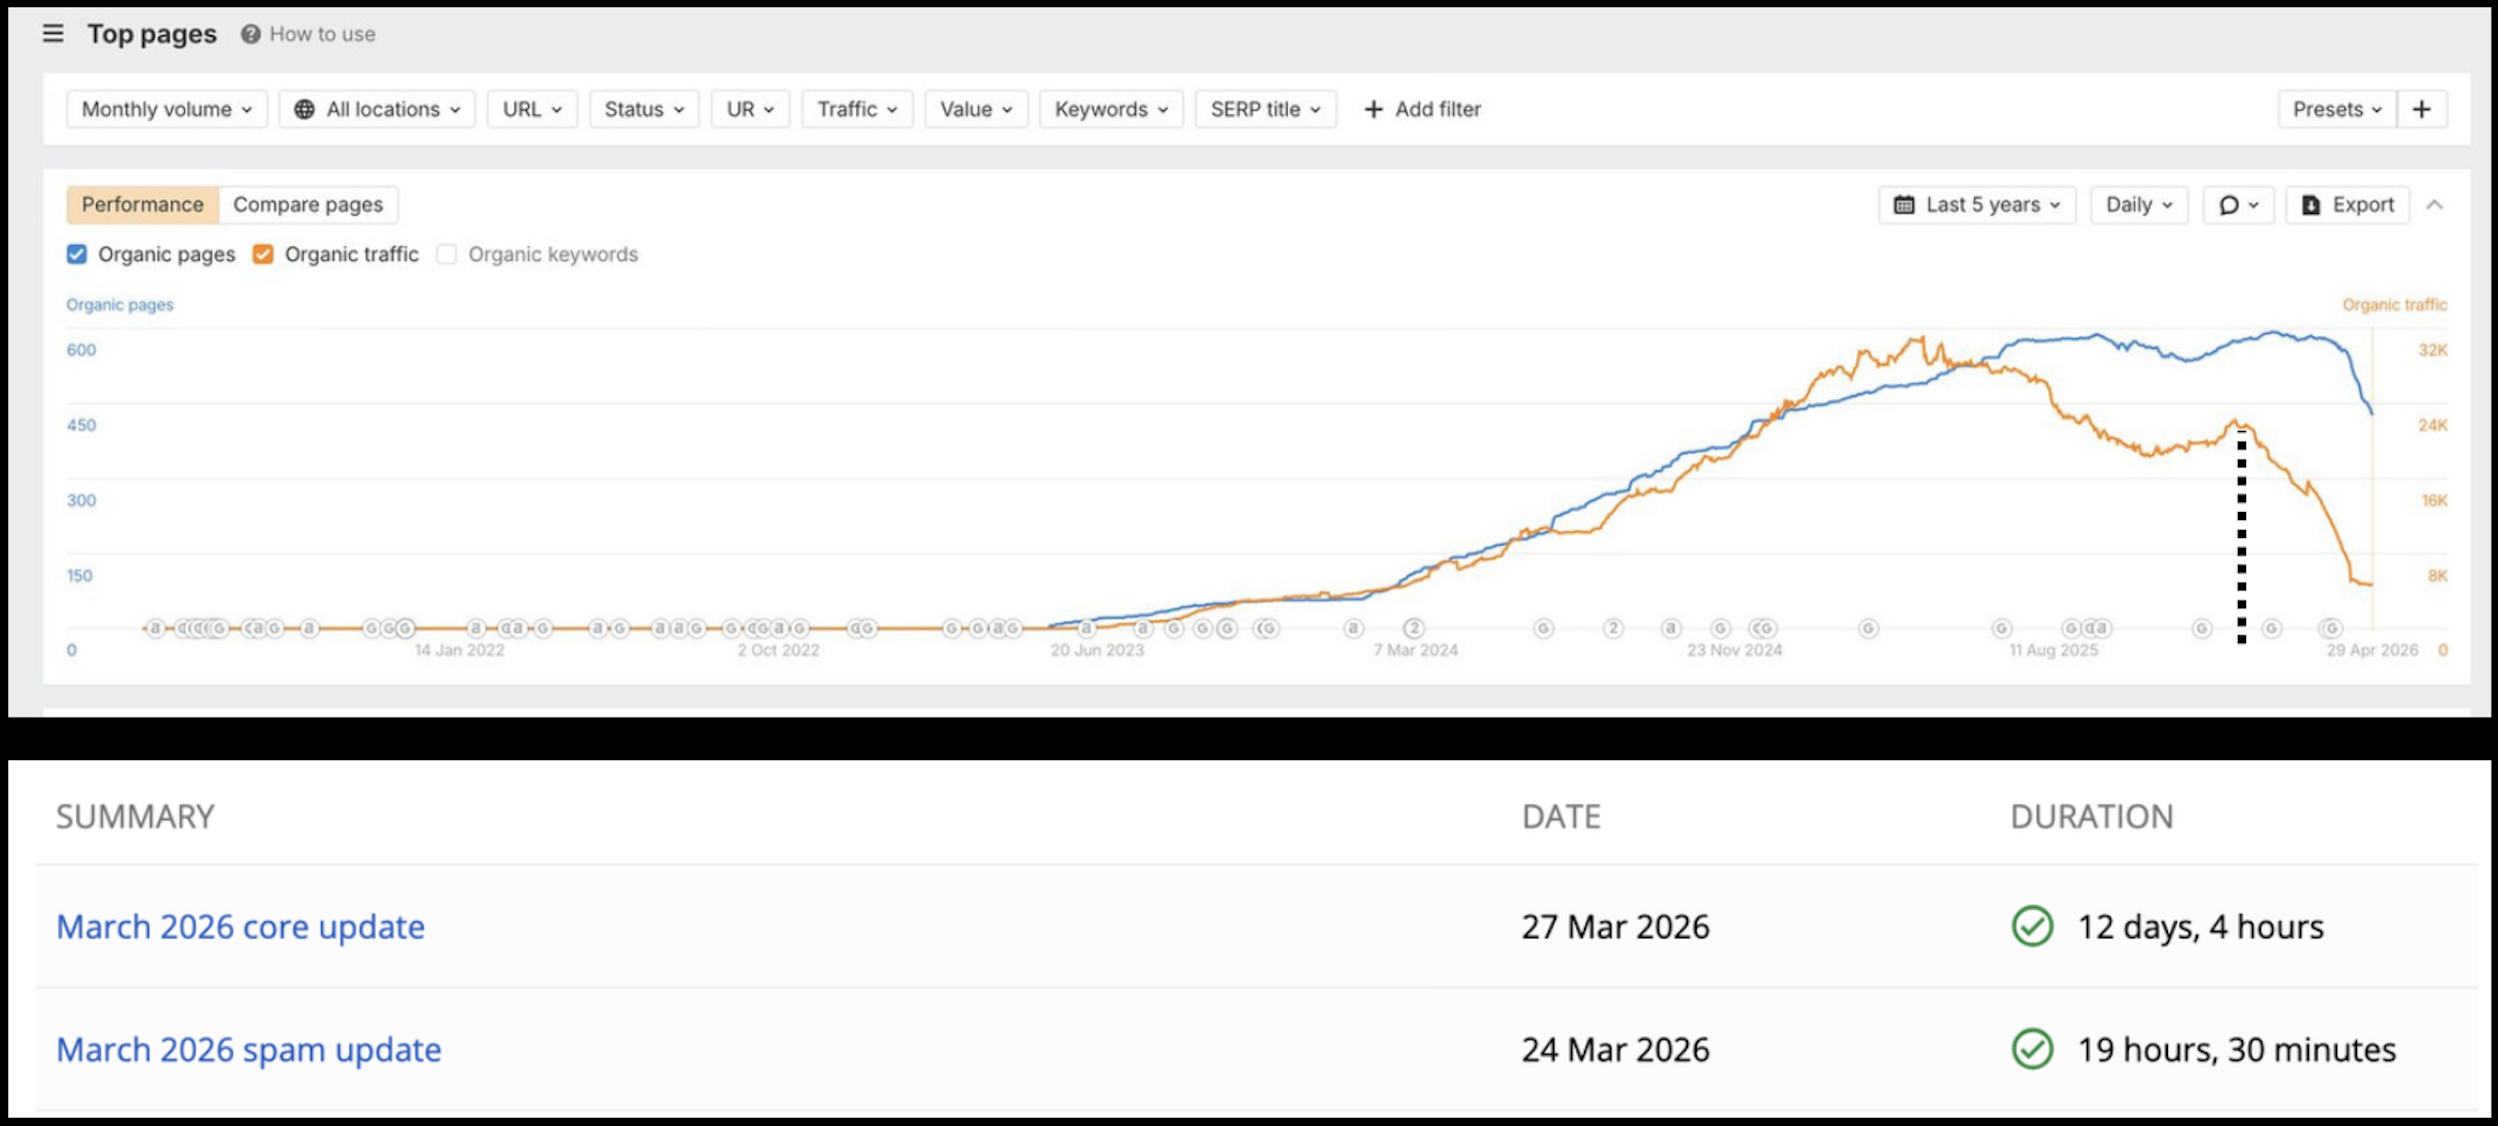
The chart above is a blog that grew from under 200 ranking URLs in 2023 to about 600 by spring 2026, on articles commissioned to “close topical authority” around one service. Traffic peaked near 32K a month in August 2025, the month of that year’s spam update, and slid through the autumn while the page count kept rising. That divergence is the signature: production continued, and each new page was scored against a SERP the site had already restated. The 24 March spam update and the core update that started on the 27th took most of what remained in two weeks, and the page count itself turns down at the right edge of the chart, which is the tail losing its rankings. Nothing in Manual actions. The Pages report for the same months is the Crawled – currently not indexed slide described above.
Links that are still there. A drop that Ahrefs can’t explain, because the referring domains haven’t moved, is often a link set that Google stopped counting. Since December 2022 Google has said its systems neutralize links they classify as bought or placed to pass weight, and neutralized links stay in the profile and stop counting. The signature is a plateau in every third-party link chart and a fall in positions for the pages whose rankings sat above what their content could hold on its own. There’s no report for it, and no date on it, so the read is indirect: which pages dropped, what their link profiles look like relative to the rest of the site, and whether their content would rank where it ranked without those links. The mechanics of what passes and what gets zeroed are in the 301 redirect piece on this site. The point here is that “we lost authority” can be true while the backlink export says nothing changed.
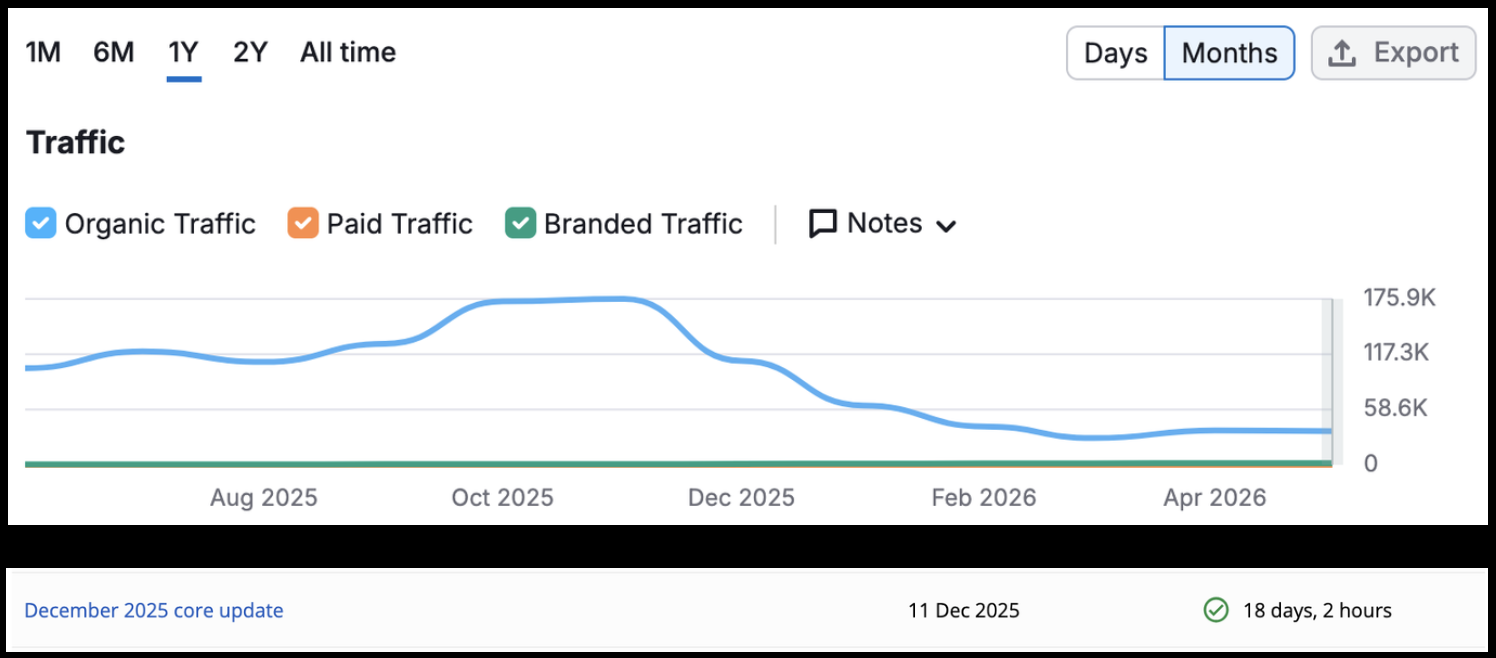
This one came in as “the December core update.” The profile behind it was bought links at volume, exact-match commercial anchors on most of them, from domains with nothing else on them, and none of it had moved in the backlink tools. Against the table above it’s the second row: branded traffic flat along the bottom of the chart, non-brand falling site-wide. The dates are the finding. The bend is in late October, six weeks before the update window opens on 11 December, and the second leg runs through the rollout and past it into February, where the line flattens at roughly a third of the October peak. An update that starts six weeks into a decline didn’t start it. What fits the shape is a link set being discounted in stages, which Google doesn’t announce and doesn’t date, and the update was the label the owner had for it. The recovery is the content-versus-links read, page by page: which positions the site can hold on its own. A disavow adds nothing here, because Google had already stopped counting those links.
Neither of these is a penalty, and neither appears in Manual actions. Both are recoverable. Waiting for the next update recovers neither.
Displacement: SERP features, competitor pages, cannibalization
This is the section most guides reduce to “check competitors,” and it’s where the audit either finds something or admits it hasn’t. For each query cluster that dropped, the question is who holds the positions now, and the answers come in three kinds.
A different kind of result. The query used to return ten articles and now returns an AI Overview, three videos and a Reddit block above the first article. Positions may be unchanged; the click budget above the fold went somewhere else. Search Console’s Search appearance filter shows which features your pages appeared in; the SERP itself, fetched from the right country, shows what’s above you now. The fix is a decision, and it isn’t on the page: whether the intent is still yours to win in that format.
A competitor’s page. Not “competitors improved” but a URL, for each query, that now ranks where yours did. Pull it, and read it against yours the way a retrieval model would: what does it cover that yours doesn’t, which entities and passages does it have that yours lacks, what does it add against the rest of the top ten that yours restates. I run that as an information-gain score, your page and the replacement scored against the same SERP corpus, and the two numbers usually end the argument: a page that was original against last year’s top ten and is now an echo of this year’s has been displaced by the SERP moving. The method lives on the information gain page. Here it’s one page against one replacer.
Your own page. The most common displacement on sites with a blog, and no rank tracker reports it as a loss, because the domain still ranks. The page that dropped was replaced by a newer page on the same site that answers the same intent, and Google picked the newer one; the older one’s positions went to a sibling. In Search Console it shows as the query’s top page switching URL on the date of the drop. On the topical map it’s a pair of pages sitting at a cosine similarity above the cannibalization threshold (0.995 for a within-cluster pair on our last run), with both URLs holding impressions on the same queries. The fix is a merge with a 301 to the survivor, or a split of intents, and a rewrite is neither.
Content decay and intent drift
Not every loss has a date. A page that held position 4 for two years and now holds 9, with no bend in the line and no event on either calendar, has decayed, and decay has three usual mechanisms that get confused for one. The content aged: the facts in it are from 2023, the tools it names have been renamed, and three newer pages in the top ten carry this year’s numbers. The internal links thinned: every redesign and every new article since has taken one or two links away, and the page’s internal PageRank has halved without anyone deciding it should. Or the SERP moved: the intent behind the query shifted from “what is” to “which tool,” and the page still answers the old question well.
Decay is measured against the page’s own peak, because a cluster average hides it: three pages growing and two decaying net out to flat. A content audit that grades each page on its own impressions-to-peak ratio surfaces the decaying ones as a list, and the grade, refresh, merge or leave, depends on which of the three mechanisms the page shows. A refresh that adds nothing the current top ten doesn’t already have won’t reverse the slope; the date-test applies here too, three things in the page that weren’t true a year ago, or the refresh is cosmetic.
Website rankings loss audit report and recovery timeline
The deliverable is one line per finding, not a list of everything that could be improved, and the line has five fields:
- Cause — what dropped the segment, in one line.
- Evidence — what proves it: the status count dated to the deploy, the before/after crawl diff, the replacer’s score, the cannibalization pair.
- Segment — which part of the site the cause explains, and how much of the loss that segment carries.
- Fix and owner — a canonical rule is engineering’s, a merge is content’s, a redirect map is the platform team’s.
- Re-measure date — when to read the same segment again.
A rankings loss audit that names a cause without a re-measure date is a hypothesis dressed as a report; the date is what makes it testable.
On timing there isn’t much to say. Technical causes recover on Google’s next crawl of the affected pages, days to weeks, and the recovery is visible in the same Pages report that showed the failure. Displacement recovers when the page has something the replacer doesn’t, which is a content decision and a build. Update-attributed drops recover at a later core update or not at all, and I don’t give a date for those, because nobody has one. Fixing the cause is the build. This article is the reading.
Frequently asked questions
How do I know it was a manual penalty?
The Manual actions report says so, with the policy named. If it’s empty, it wasn’t, whatever the drop looks like.
Rankings dropped after a migration — what first?
The Pages report for the old URLs and the new: old ones should be Page with redirect, new ones indexed. Anything else — old URLs still indexed, new ones in Discovered – currently not indexed, Redirect error — is the migration, and the redirect map is where it broke.
Can competitors cause the drop?
A competitor’s page can take your position, and the audit names the URL and what it has. “Competitors got stronger” without a URL is not a finding.
Should we build links to recover?
Only if the audit found a link loss — a referring domain set that disappeared, dated — and even then the links that left were probably the reason the page ranked above its content. Links are the last rung, and most drops never reach it.
Can you guarantee recovery?
No. The audit can guarantee a cause with evidence behind it, or a statement that the evidence doesn’t reach one. Recovery is what the fix does, and some causes — a SERP that changed format — don’t have a fix on your side.
What I don’t have
A way to prove that an update caused a drop. There’s no control group for a single site; the competitor-set test above is the nearest thing, and it tells you whether the category moved, not whether Google reassessed you specifically or why. When the ladder reaches the update rung and the displacement read comes back even, the report says “coincides with the update; no site-side cause found; re-measure on this date,” and I’d rather write that sentence than a paragraph of E-E-A-T advice that fills the space and explains nothing. The other number I’d like is how often “it was the update” turns out, on decomposition, to have been something on the site; I can say it’s most of the cases I’ve read, and I can’t give you a share, because I only see the ones that come in with the update already blamed.
The decomposition, brand against non-brand, folder against folder, position against click on a dated line, is the first screen of every report I write now, and I’d expect it to be the first screen of everyone’s within a couple of years. If a drop of yours is still explained by a date, that reading, on your Search Console and your crawl, is what our SEO audit starts with.