
A B2B site ranks. It pulls traffic. The content program cost real money and it’s working, by every number on the dashboard — impressions up, positions up, sessions up. And the pipeline is flat. Nobody on the marketing team can point to what’s wrong, because on paper nothing is.
A B2B SEO audit is a diagnosis of that gap: which of the site’s pages meet a buyer with budget, which meet a student or a job-seeker, and where the path from a ranking to a qualified opportunity breaks. A normal SEO audit answers “what’s broken on the page” and hands back a spreadsheet, 200 rows sorted by severity. It never reaches the question that decides a B2B site: why does traffic with good rankings fail to turn into deals? A couple of the pages ranking for this term now open with that question. Fewer show how to measure the answer. That’s what this is.
Same boundary as always. This is how I find the damage. Rebuilding the architecture, writing the pages, wiring the schema is separate work, and I’ll mark where a finding turns into build work rather than blur the two.
B2B SEO vs B2C: query volume, buying committee and deal cycle
The queries are low-volume and high-value: a term with 50 searches a month can be worth more than one with 50,000, because the 50 are buyers with budget and the 50,000 are students and job-seekers. The visitor is a committee — Gartner puts the typical buying group for a complex purchase at six to ten people — the engineer who researches, the manager who shortlists, the finance lead who signs. The language runs by solution, industry and use-case, not by the tidy keyword a tool hands you. And the decision is multi-touch rather than long: TrustRadius puts the average deal cycle at 3.8 months, with 86% of deals closing inside six, so a “conversion” is rarely one click’s work, and the audit window for reading whether search produced a deal is a quarter, not a year.
There’s a fourth difference that changes how a B2B SEO audit reads traffic, and it comes from the buyers themselves. In TrustRadius’s 2026 survey of 1,862 technology buyers, 79% had already heard of the product they bought before formal research started, the average shortlist was 2.7 vendors, and 67% bought the one they favored at the outset. Ehrenberg-Bass’s work with the LinkedIn B2B Institute puts the share of category buyers in-market at any given moment around 5%. Put those together and most of the search you’re auditing is a shortlisted buyer confirming a decision, or a researcher building the internal case for one, with discovery a minority. A page that treats that visitor as a stranger to be educated has already lost them.
A B2B audit runs one equation: demand → intent → buyer → page → lead → pipeline. Every arrow is a place the chain breaks while the traffic numbers stay green.
Most of what breaks lives in the seams between what the market searches, what the site answers, and what reaches revenue, and a page-level crawl never sees a seam. The sections below are those seams, one per arrow, ordered by how much pipeline usually leaks through each.
NavBoost and lead-to-opportunity rate: joining Search Console, GA4 and the CRM
High-volume traffic that produces no qualified opportunity costs you rankings, and Google has put the mechanism on the record twice.
TWO THINGS GOOGLE PUT ON THE RECORD
In the 2023 DOJ antitrust trial, Google VP of Search Pandu Nayak testified under oath that a click-based re-ranking system called NavBoost is one of the most important ranking signals Google has. Months later, the May 2024 Content Warehouse API leak named the mechanics: NavBoost tracks click quality, not click counts, through fields the leak spelled out as goodClicks, badClicks and lastLongestClicks, aggregated over a rolling window of roughly 13 months. The trial established that it matters; the leak showed how it works.
For vanity traffic that means the following. A page with an irresistible title and thin substance gets the click and loses the visitor — they land, find nothing that resolves the query, and bounce back to try the next result. To NavBoost that’s a badClick, and the listing they finally settle on becomes the lastLongestClick instead of you. The page doesn’t just fail to convert the buyer. It teaches Google, across a 13-month memory, that it didn’t satisfy the intent, and gets re-ranked down for it. The traffic that looks like a win is feeding a signal that works against you.
Reading this needs two systems joined. On the site side, the landing page from GA4 or the query from Search Console. On the revenue side, the CRM’s own attribution — HubSpot’s original-source drill-down, Salesforce’s lead source and campaign fields — because the lead that becomes an opportunity is recorded there, not in analytics. I join them at the landing page and read one number per page template: lead-to-opportunity rate, with opportunities created rather than form fills as the numerator, since a demo request from a student is a form fill. Per template matters because a site-wide rate averages the solution page with the blog and reports a number that belongs to neither. I also split brand from non-brand queries in Search Console with a regex on the company name, because a site whose organic conversions are 80% brand has a demand-generation problem that no amount of ranking work touches. If the join doesn’t exist yet — no UTM discipline, no source field on the opportunity — building it is the first build item, and it goes above everything else.
WHY THE JOIN COMES FIRST
Pipeline360’s 2026 State report found only 19.1% of B2B marketers track pipeline contribution as a KPI. The KPIs they do track are page views, social followers and click-through rate — the three numbers that stay green while the pipeline stays flat.
Commercial intent coverage: the B2B demand ladder from problem to pricing
For every way the market shops — by problem, by solution, by industry, by use-case, by comparison, by integration — is there an indexable page built to catch that intent and rank for it? Or is the demand landing somewhere wrong, or nowhere? A crawler can’t run this check; it’s demand-side, and it’s where the biggest gaps hide.
The failures are consistent across B2B sites. A high-value intent with buyer demand and no page targeting it, usually the highest-margin money on the site. A blog post ranking where a solution page should be, so the visitor meets you in an educational frame when they were ready to evaluate a purchase. Two pages splitting one intent, each too weak to win because the site competes with itself. None of these show up as errors in a crawl. Every one is a hole in the revenue path.
There’s a structural version of this gap, and it’s the most common shape of all. Most B2B sites are built as Homepage + Product + Blog. But B2B demand runs down a ladder, and for a warehouse-management vendor the rungs look like this:
| Rung | Example query | Buyer stage |
|---|---|---|
| Industry / problem | “3PL inventory accuracy” | research |
| Solution | “warehouse management software” | research |
| Use-case | “WMS for cold storage” | evaluation |
| Integration | “WMS Shopify integration” | evaluation |
| Comparison | “[vendor] vs Manhattan” | decision |
| Pricing | “warehouse management software pricing” | decision |
A site with a product page and a blog covers the top of that ladder and the bottom rung, and nothing in between. That in-between is where evaluation-stage buyers search. The audit question: does the site cover the whole ladder, or two rungs of it?
Underneath sits a subtler failure, product-language mismatch. Companies optimize for the way they describe the product; the market searches for the way it thinks about the problem. Internal category names, product-line branding, the taxonomy the company files its own thinking under — none of it is how a buyer types the query. The fastest check is to set the Search Console query report against the site’s navigation labels: if the words that bring impressions don’t appear in the menu, the page and the demand exist and never meet.
The demand side takes more than one keyword export. I pull the terms already bringing the site impressions from Search Console, run the head term through its own semantic fan-out — the use-cases, comparisons and adjacent-market phrasings a keyword tool flattens into one line — and set that whole set against the pages that exist. Every demand cluster gets read one way: does a page on your side answer it, or does the ranking set answer it while you’re silent. What comes out is a list of commercial intents with no page behind them. Building the missing pages is the build.
Buying committee queries: engineer, security lead, procurement, end user
A single B2B purchase is researched by people who search for completely different things, and most sites are written for one of them — usually the marketing manager — and are invisible to the other three. One product, four search personas, four kinds of page:
| Role | What they search for | Query modifiers | Page that answers |
|---|---|---|---|
| Engineer | integration docs, architecture, a sandbox key | api|sdk|integration|webhook|docs|architecture | docs, integration pages |
| Security lead | compliance, a place to send a questionnaire — “[vendor] SOC 2,” “[vendor] trust center” | soc 2|iso 27001|gdpr|hipaa|trust center|security | trust center, security page |
| Procurement | pricing, a comparison against the vendor they already use | pricing|cost|vs|alternative|comparison|review | pricing, comparison pages |
| End user | a how-to | how to|tutorial|guide|template | help center, tutorials |
Procurement increasingly runs its search on G2, Capterra or TrustRadius rather than on Google, so your “[vendor] vs [competitor]” page is competing with a review site’s version of the same page, and usually losing to it.
The check runs role by role, and it’s measurable in Search Console rather than asserted. I group the site’s queries by the modifiers in the table and count two things per group: impressions, and pages with clicks. A group with impressions and no page is a seat at the table nobody’s talking to. On most B2B sites the security and engineering groups come back with impressions in the thousands and one page each, usually a PDF, while the marketing-manager group has forty. The gap is rarely a total absence of content. Usually the site has plenty, pitched at one seat of the table, while the people who block or approve the deal find nothing — a site ranking cleanly for what the manager searches, invisible to the CTO who signs off.
Information gain: scoring content against the ranking SERP
Everyone says B2B sites have thin content. It’s true, and it settles nothing, because “thin” is an opinion until you can answer thin against what. Word count doesn’t answer it — a 2,000-word page can be thinner than a 400-word one. The benchmark is the live SERP: the specific pages already ranking for the query this page wants. A page is thin when it adds nothing those pages don’t already say.
GOOGLE PATENTED THE BENCHMARK
The framework is Google’s, in writing. US Patent 11354342B2, “Contextual estimation of link information gain,” filed in 2018 and granted in 2022, describes scoring a document by the information it adds beyond what the user has already seen on the results before it. That’s information gain, and the continuations Google has kept filing carry the idea into the AI-answer era, where “does this page add anything new” is the whole question a summarizing engine asks before it cites a source.
Information gain, in plain terms: does this page say anything the pages already ranking don’t. A page can be well-written, accurate, and still add nothing — a tenth restatement of an answer the index already holds. To the ranking system that page is redundant, however well it reads.
I measure it. I take the page and the pages ranking for its target query, break both into their passages, and read how close each of your passages sits to what’s already out there. A passage that lands almost on top of the ranking set adds nothing; the score is the share of the page that clears that bar. When it comes back near zero, the page is redundant, and no amount of added words fixes that. The bar moves, too: it’s set by how much the ranking pages already repeat each other, so “redundant” is measured against this SERP, not a global guess. The fix is either differentiation or the decision that the page shouldn’t compete for that query at all.
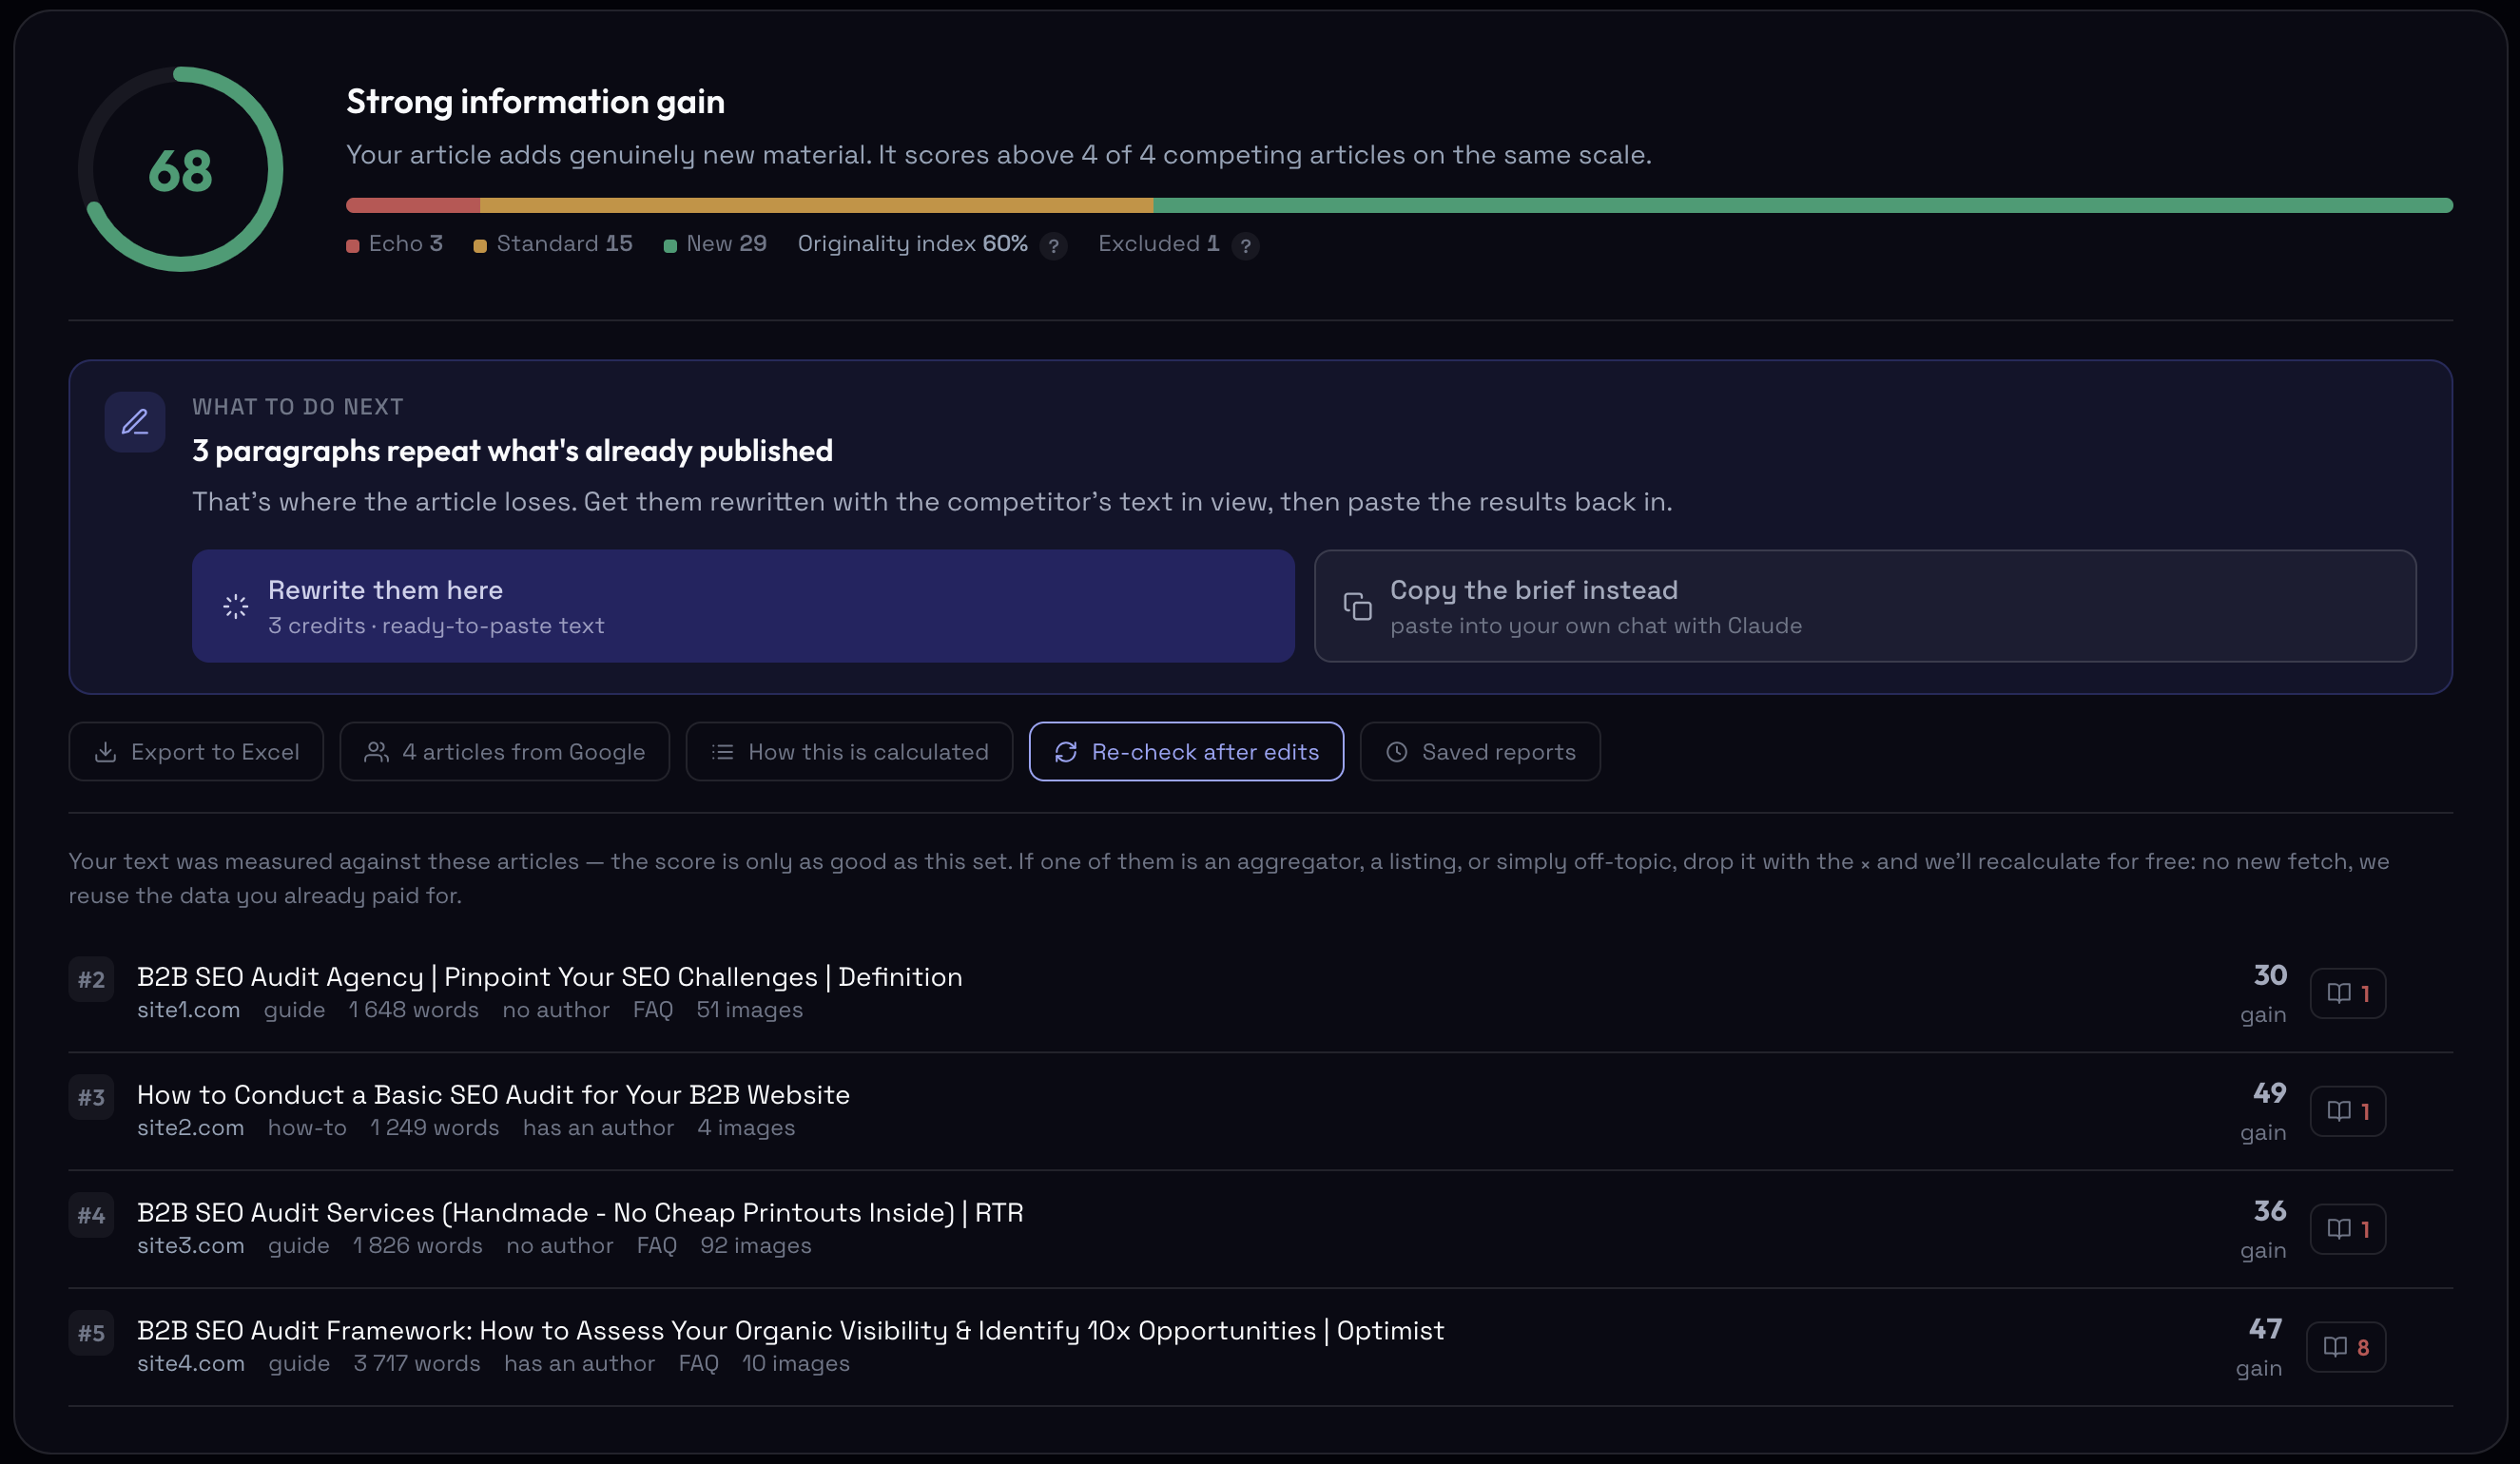
The page in the screenshot is this one, scored against the four guides ranking for its own query. Forty-seven passages measured: 29 read as new, 15 as standard, 3 as an echo of what’s already published, for an originality index of 60% and a score of 68. The four competing pages score 30, 49, 36 and 47 — and the 49 belongs to a 1,249-word how-to, while the 47 belongs to a 3,717-word framework. Three times the words, two points less gain. The three echo passages are the ones I’d rewrite first; a page written to say something new still has three paragraphs that don’t.
E-E-A-T and authorship: author pages, Person schema, entity resolution
Authorship carries more weight in B2B than in most niches, because two audiences read it at once — Google’s quality systems, and a buying committee deciding whether to trust the vendor. That’s the E-E-A-T layer, and it’s a judgment a crawler’s export can’t make.
Google has leaned harder on authorship every year, and hardest on the topics it calls Your Money or Your Life: health, finance, safety, the decisions where bad advice does real damage. Google’s own definition is about harm to people and society, not to companies, so B2B isn’t YMYL by the letter. In practice the quality systems treat a page recommending a compliance approach or a six-figure platform with the same suspicion, because the cost of being wrong is the same shape. On those topics they want to see a person with standing behind the words. Google’s own “who, how and why” guidance for creators asks exactly that — who wrote it, how it was produced, why it exists.
I check authorship by hand, article by article. Do the pieces carry author pages, or a byline that points nowhere? Is there a linked, credentialed identity behind the writing — a profile, a bio, Person schema with a sameAs to a LinkedIn or a company page, the machine-readable signals that tie a name to a person Google can place — or does the content ship under “Admin” or “Guest Author”? The strongest version of standing is one Google can already resolve: an author who exists as an entity, with a knowledge panel, a Wikidata item, a profile the “about this result” panel links to. That’s rare on B2B sites and worth flagging when it’s there, because it’s the difference between a name and a node. To a ranking system that reads authorship as a trust signal, a name in plain text is a page with no one behind it.
The committee reads the same thing differently. The CTO evaluating an architecture guide, the security lead reading a compliance page — they want to know the person who wrote it has done the work, engineering or industry experience, not “our team of professionals” over a stock photo. On topics that sit close to money and security, unverifiable authorship is a trust problem for the buyer and a quality risk for the ranking. The check is concrete: which pages carry a credentialed, identifiable expert behind them, and which are anonymous.
Blog audit: helpful content system, site-wide classifier, cannibalization
There’s a site-wide risk B2B teams walk into by doing the thing everyone told them to do — publish more. Google’s helpful-content system has been a site-wide classifier since it launched in September 2022; the March 2024 core update folded it into the core ranking systems, so it no longer runs as a separate update you can see coming. Google’s wording: content on a site with relatively high amounts of unhelpful material overall is less likely to do well in Search. Overall — including the solution and service pages that sell. A pile of thin, AI-spun blog posts doesn’t just fail on its own terms. It pulls down the pages you care about most.
And the recovery clock is unforgiving. The signal re-rates algorithmically, and the re-rating typically lands at a later core update, months out; the sites that recovered from the September 2023 wave mostly did so a year or more later, at core updates in late 2024 and 2025. A blog dragging the domain today keeps dragging it until Google runs the next pass and notices you cleaned up. No button, no appeal.
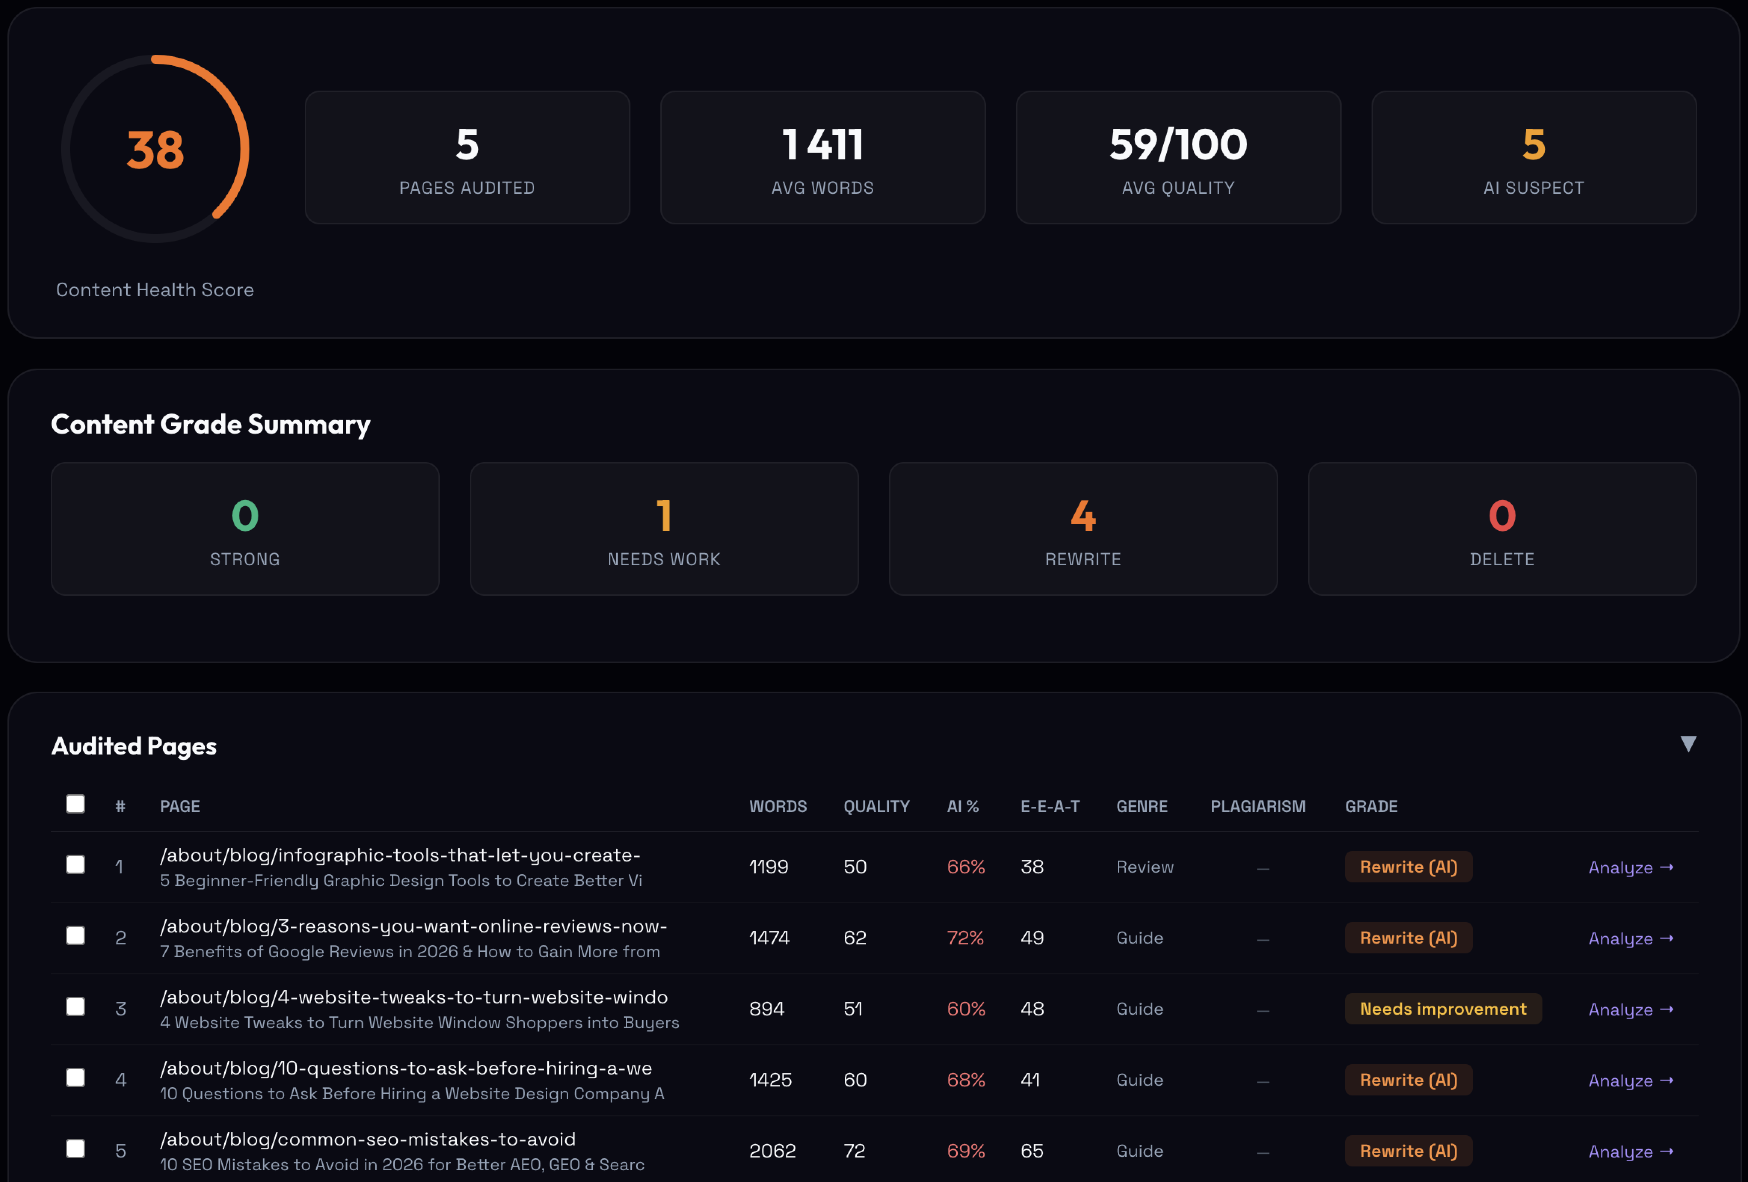
I read the blog as a system, not a stack of posts. Each article gets graded on its own writing quality and how much topical depth it carries — and the grade is explainable, every time, not a black box. Two posts circling the same intent get caught as cannibalization. The grade doesn’t come from a word counter, and it never comes from an AI-detection score.
That last point matters for B2B especially. Detectors flag careful human writing too — clean structure and even rhythm are craft signals the machine copied, and people now get penalized for them. The AI percentage is a flag for a human to judge, never a verdict on its own. Consolidating or cutting what the grading flags is the build.
Backlink audit: search competitors, anchor profile, internal equity
B2B link diagnosis starts by throwing out the competitor list the sales team hands you. The company you lose deals to often isn’t the company you lose rankings to. Audit your backlinks against the rival sales names, and the whole link plan aims at the wrong target — you end up chasing the profile of a site you don’t compete with in the results. The first move is to find the search competitors: the domains that keep out-ranking you on the terms that matter, identified by how much keyword and link ground they share with you, not by reputation. On a typical B2B site that list is a review platform, a publisher and one vendor the sales team has never mentioned.
Then the second assumption. Authority doesn’t spread evenly across a site — it pools by topic. Your solution pages can be commercially central and starved of links at the same time, while the blog hoards the internal equity everyone points at by habit. That orphaned-commercial-page problem gets worse at scale, where the enterprise version of this audit covers it in depth, but even a mid-sized site has the pattern: the page that should rank, with nothing on the site voting for it.
I read links by what they carry. A single domain-rating number answers a different question: a DR of 72 tells you the linking site is strong, and nothing about whether the link is relevant, in context, or worth anything to the page it points at. What I read instead is the anchor profile per target page. A healthy page carries mostly its own name and plain editorial phrasing: branded anchors somewhere between a quarter and 60% of the profile, naked URLs 10–30%, exact-match keywords 1–10%, commercial phrasing under 5%. The two failures sit at either end: a commercial page stacked with exact-match keyword anchors, the footprint a manual review reads as manipulation — or the same page with almost no links at all, commercially important and invisible to the rest of the site.
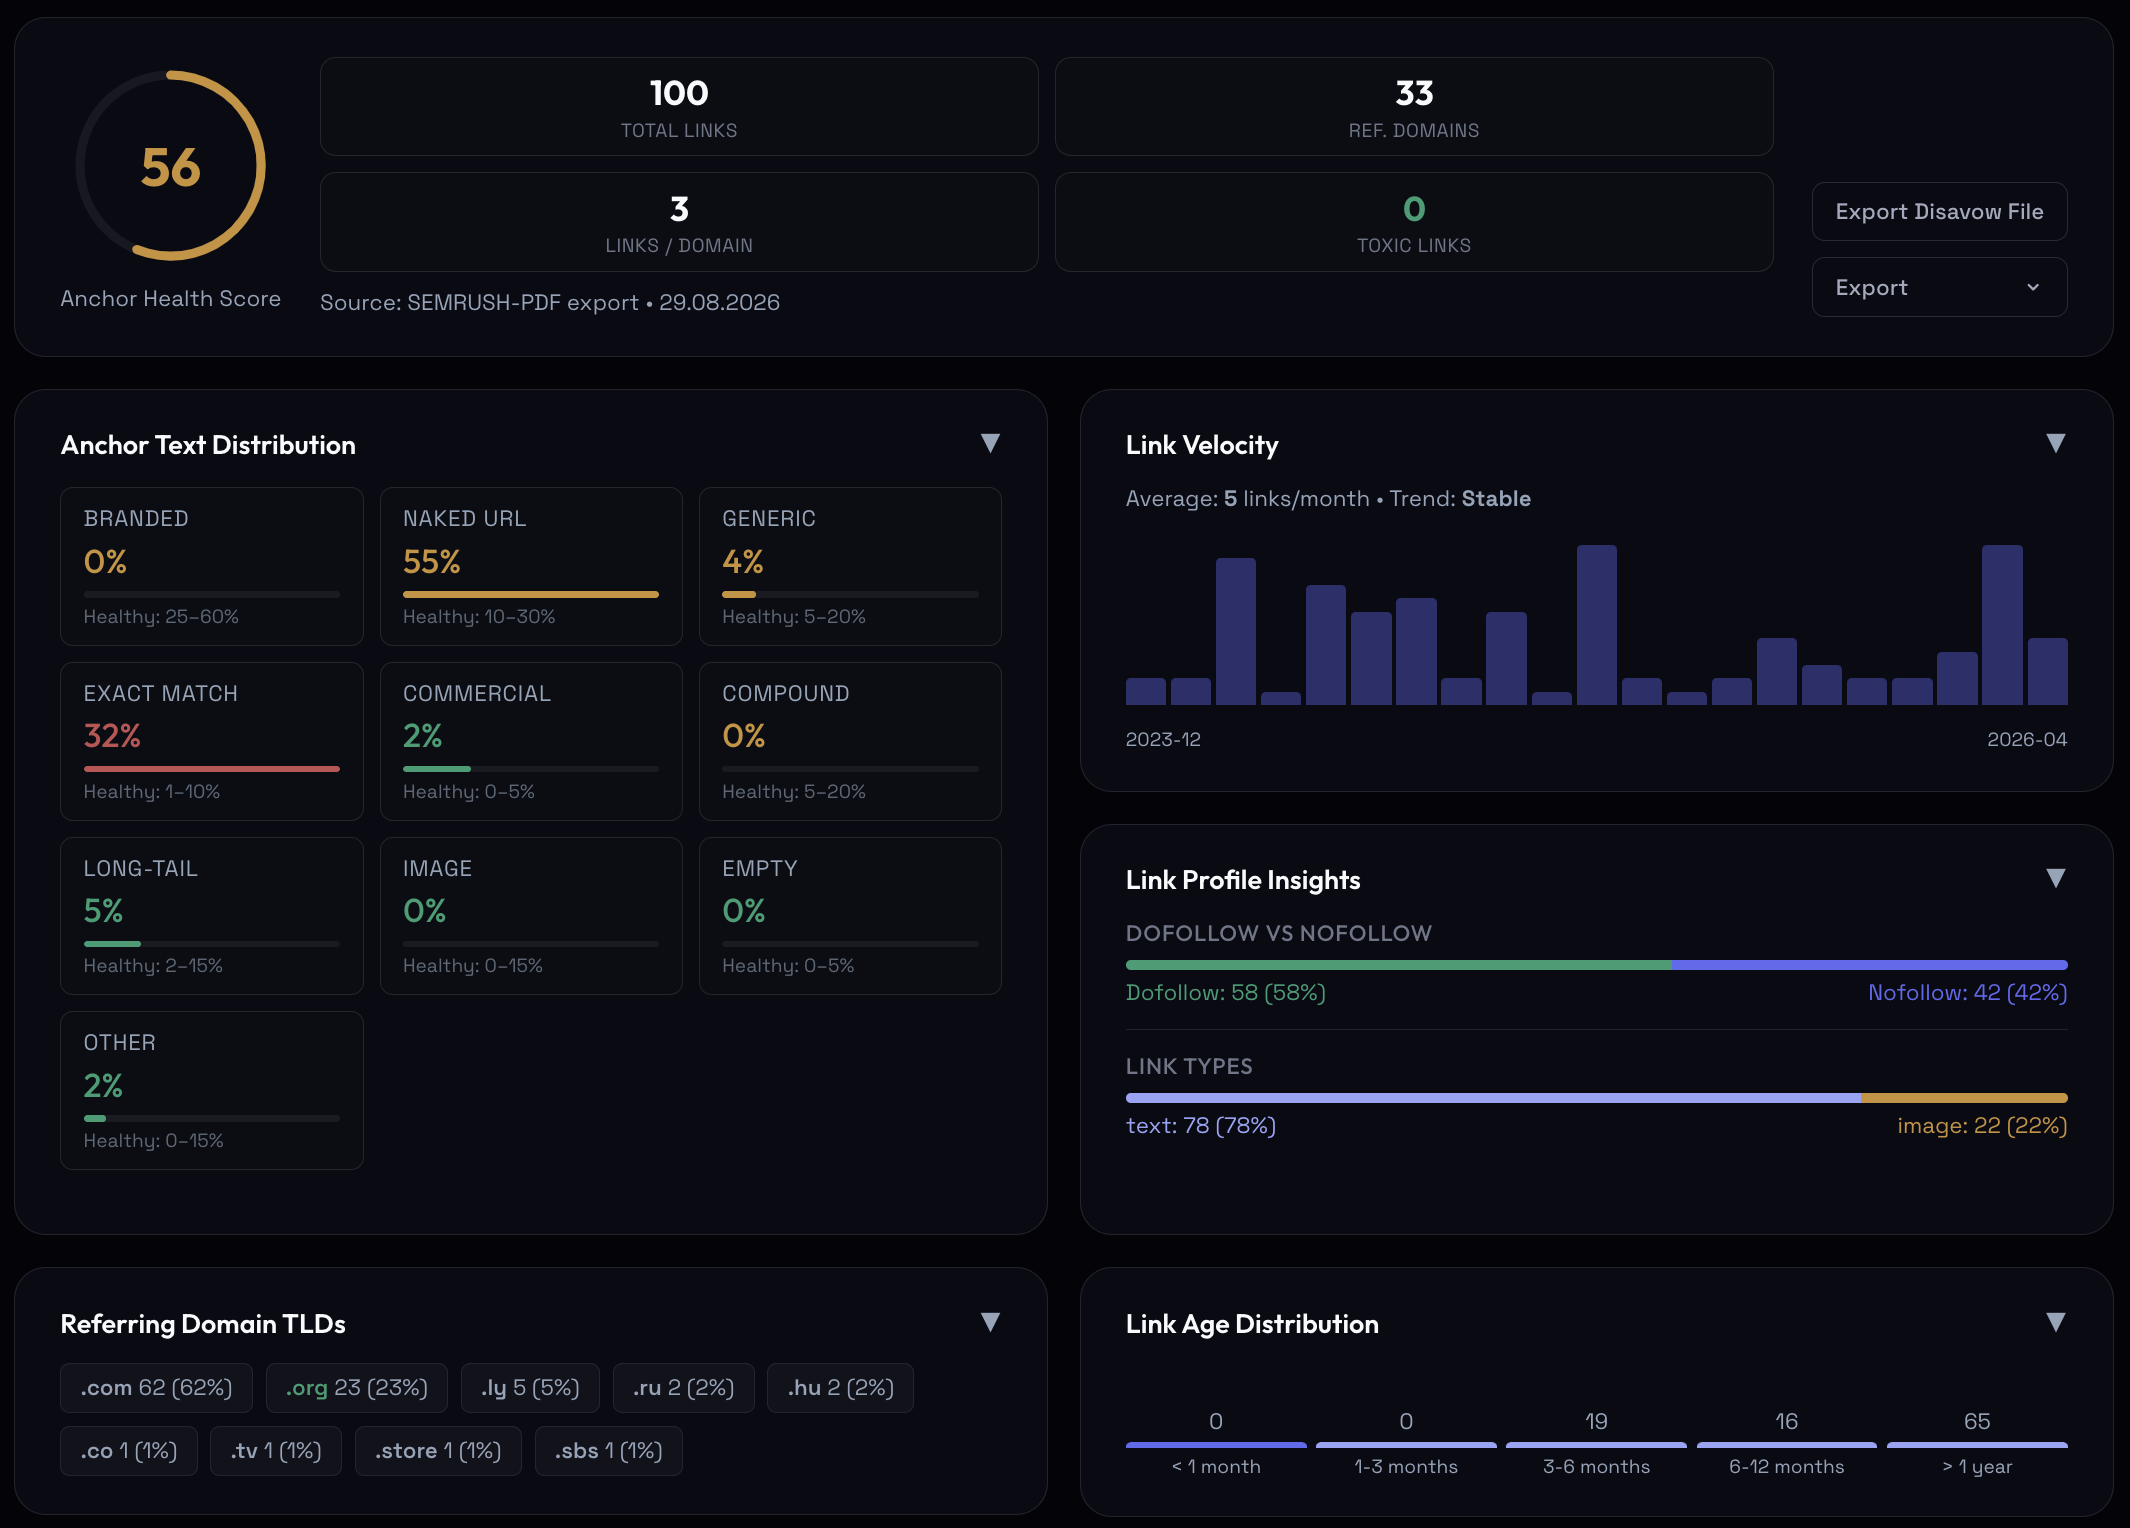
The profile in the screenshot is a Semrush export from late August: 100 links from 33 domains, velocity a steady five a month, and zero links flagged toxic. It’s also 0% branded, 55% naked URL and 32% exact-match. Nothing in it is toxic by any tool’s definition, and it still reads as a footprint, because a third of the anchors are the keyword and none of them are the company’s name. That’s the read a domain score and a toxicity filter both miss — the profile is clean by every filter and shaped by every read.
There’s a recovery version of the same read. When a site drops after a core update, the useful question is which specific links are dragging it. Read one at a time, a paid placement leaves a shape: a host that publishes any topic for a fee, risky-niche neighbors on the same domain, a commercial anchor where an editorial one belongs. One of those is a flag. Several on the same link is a verdict.
Once the diagnosis names which authority you’re missing against the search competitors, the rest is ordinary link work, pointed at the right target instead of the sales team’s list.
Commercial page audit: buyer factors and pricing transparency against the top 5
Once the buyer lands on your solution or pricing page, does it give them what they need to choose you, and does it have anything the competition doesn’t? That’s measurable against the pages already winning. I take your commercial page and set it beside the top-ranking set for the same query, and I read two things off the comparison.
The first is parity: the buyer factors the winning pages carry and yours doesn’t. Published pricing or a range where the niche norm is “call for quote” — transparent pricing has topped TrustRadius’s buyer wish list four years running, 45% in 2026, and buyers who can’t find a price assume it’s high or negotiable and drop the vendor from a shortlist that only had three names on it. A true-cost breakdown that names the fees competitors hide. A comparison against alternatives that gives them their strengths, including “do nothing.” Named experts with credentials instead of “our team of professionals.” A concrete guarantee instead of “satisfaction guaranteed.” Each of these is a reason a buyer picks one vendor over another, and each is a row where your page can be silently short. They matter more than they used to for a specific reason: TrustRadius found 94% of buyers who used AI in their research fact-check what it told them, and the place they fact-check is your page. A claim the page can’t back is now a claim that gets you dropped.
The second is the more interesting one, the open slots. Some proven buyer-trust patterns are used by nobody in the top results — an interactive cost calculator, a before/after annotated with the job’s parameters, live availability. A missing factor everyone else has is a gap to close. A factor nobody has is a slot to own, a place to win outright instead of catching up.
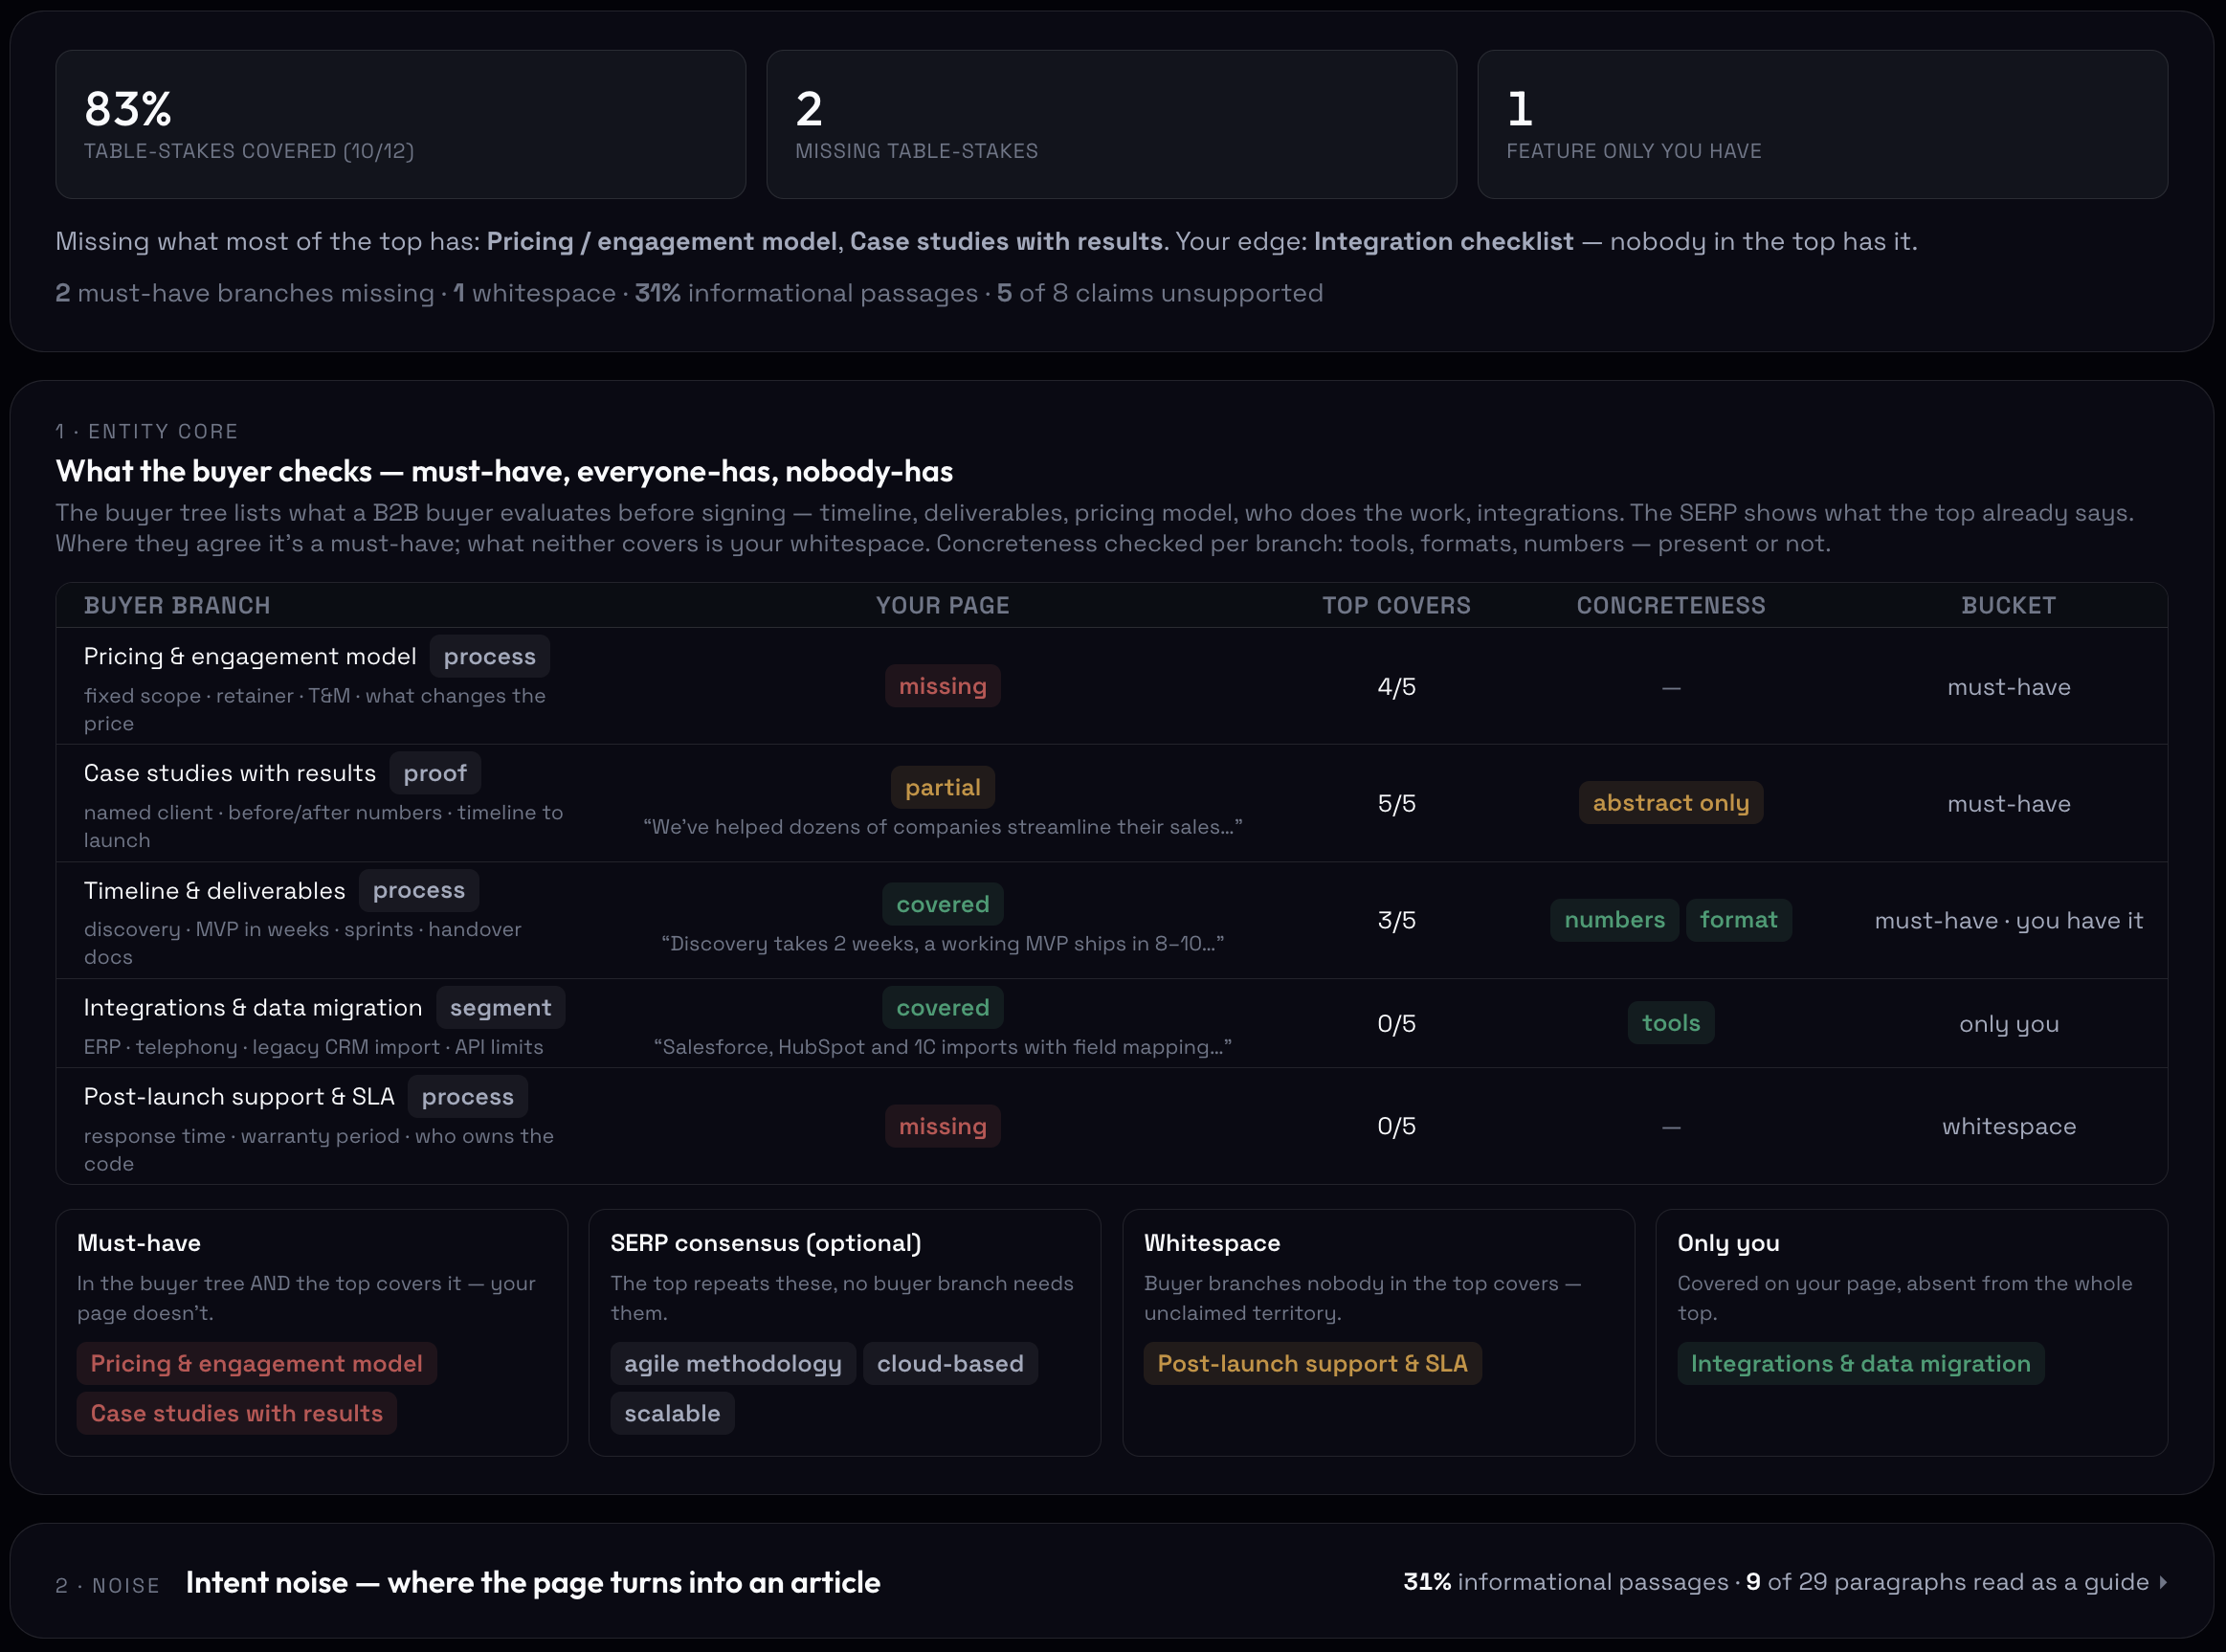
The output is a list: these three factors are missing and the top five all carry them; this one slot is open, take it.
CTA and form audit: intent stage vs CTA type, form_start and form_submit
One arrow in the equation gets audited by nobody — page → lead. The SEO team stops at the ranking, the CRO team starts at the form, and the thing between them is a page with the right visitor on it and one call to action that doesn’t fit. On most B2B sites there’s exactly one: “Book a demo,” on every template, from the glossary page to the pricing page. A researcher building an internal case isn’t booking a demo. A shortlisted buyer on the comparison page might, but a security lead on the trust center wants a questionnaire address, and an engineer on the integration page wants the docs and a sandbox key. The page caught the right person and offered them the wrong door.
The check is a matrix. Each page gets an intent stage from its own queries — research, evaluation, decision — and each page’s CTA gets a type: content download, newsletter, docs, trial, demo, contact, pricing request. Then the two are set against each other, and the mismatches are the finding: evaluation-stage pages with a research-stage CTA, research-stage pages with a demo button and nothing softer, decision-stage pages with no path to a price. On the sites I read, the comparison and integration pages — the ones the ladder says evaluation-stage buyers land on — are the most likely to carry no CTA of their own at all, just the global header button.
Then the form. I read field count per template against completion, using GA4’s form_start and form_submit or generate_lead events by landing page. A form that asks a security lead for a phone number and a budget range gets a form start and no submit, and the pattern is legible: a solution page with 4% of sessions starting the form and 0.6% finishing it has a form problem, and no amount of ranking work touches it.
Last, where the lead goes. A demo request from the pricing page and an ebook download from the blog often land in the same SDR queue with the same follow-up sequence, and the CRM records both as “organic” with no page. That’s why the join in the first section has to carry the landing page: without it the SDR can’t tell a decision-stage lead from a research-stage one, and the audit can’t tell which pages produce opportunities. Fixing the CTA map and the forms is build work. Finding that a page with buyers on it has no door for them is the audit.
AI answer visibility: query fan-out, citations and entity consistency
By 2026 a B2B buyer researches in ChatGPT, Perplexity and Google’s AI Overviews before they ever touch your site. How many is a matter of who you ask. Forrester’s 2025 Buyers’ Journey Survey, across roughly 18,000 buyers, puts AI use in the last purchase at 94% and finds twice as many buyers naming generative AI or conversational search as their most meaningful source than any other, ahead of vendor websites and sales. Gartner’s March 2026 survey puts AI use at 45%; TrustRadius, in July, at 63%. The spread is survey design — “used at all” against “used in this purchase” — and I don’t have a way to settle it. What I can measure is whether you’re in the answers, and any audit that only reads the blue links can’t.
An engine doesn’t answer “best X for mid-market fintech” with one lookup. It breaks the topic into a spread of sub-questions across different intents — integrations, compliance, pricing model, migration effort, the risks — the same query fan-out Google describes for AI Mode. I take the topic apart the same way, then read each sub-question on two axes at once: are you cited in the AI answer, and do you rank in the classic results. The revealing zone is where you rank but the AI answer doesn’t mention you. That’s search strength not converting into citations. “We’re not cited” stops being a worry and becomes specific: here are the sub-questions you’re absent from, and here’s where the page that would win them back should sit.
There’s a second layer most audits skip: whether the engines can resolve you as one entity. An AI answer is assembled largely from third-party sources — TrustRadius’s report says AI recommendations are shaped by reviews, independent publications and peer accounts, and 74% of buyers consult reviews, mostly on third-party sites — so the engine’s picture of your company comes from G2, Capterra, Crunchbase, LinkedIn and Wikidata as much as from your Organization schema. I read your entity across those surfaces as a spreadsheet: one row per surface, one column per fact — category, one-line description, founding year, headquarters, product names, integrations — and the cells that don’t match. The fix is boring and it’s build work: one canonical description pushed to every surface. The audit finds where the copies diverge.
Technical pass of a B2B SEO site audit: crawl, rendering, Core Web Vitals, schema
Everything above is where the audit earns its keep. The standard technical layer still gets checked, but the top-ranking guides cover it well and I rarely find surprises on a B2B site, which is usually a few hundred URLs on a mainstream CMS. I crawl it with Screaming Frog and cross-read against Search Console: what’s indexed that shouldn’t be — tag archives, author archives, the staging subdomain someone forgot — and what’s missing that should rank. Rendering: is the content in the DOM, or does the page ship an empty shell that only fills after JavaScript hydrates, because if it’s the latter the crawler may index nothing. Core Web Vitals per template, not as one site-wide average that hides the template that’s failing. Canonical hygiene. Schema, and specifically whether Organization and Person markup exist at all, since on B2B sites they usually don’t. Mobile.
This pass rarely changes the verdict.
B2B SEO audit report: findings weighted by pipeline, effort and owner
A flat list of 200 issues sorted by severity is a technical export, not an audit, and the reason it misleads is mechanical. A crawler’s sense of “critical” has no idea which page touches revenue. It flags a critical schema warning on a page nobody buys from and a medium-severity gap on the solution page that drives half the pipeline, and it hands you the schema warning first.
The output inverts that. Severity gets weighted by commercial value: a medium problem on the pipeline page outranks a critical one on a page that was never going to sell. Findings sort by impact against effort, so the team knows what to do first, not just what’s wrong. Every finding names its owner — a demand gap is a content job, link aiming is off-page, the CTA matrix is marketing ops, rendering is engineering. Skip that column and the report has no hands to land in. And every finding sits on one arrow of the equation, so the reader can see where the chain broke: the intent with no page, the page with no information gain, the solution page missing the buyer factors that close the deal, the form that loses the lead, the lead that never becomes an opportunity because the wrong page caught the wrong visitor.
Three findings, ordered by pipeline, each naming the arrow it repairs. The other 197 are an appendix.
The three Google mechanics under the sections above aren’t going anywhere: click quality is in the ranking system on the trial record, information gain is patented and carried into the AI era, and the helpful-content signal is site-wide until Google says otherwise. My bet is that by 2028 the click-to-pipeline read stops being the differentiator that sells a B2B SEO audit and becomes the baseline every serious one is expected to show, and the reports still built to count 200 issues will read like a crawler’s export, because that’s what they’ll be.
If you want that read on your own site — the intent map, the information-gain scoring, the buyer-factor gaps, the CTA matrix, and a deliverable that names the three things holding pipeline back — that’s our B2B SEO audit.